I have an organization problem. Ideas pop into my head, new branches of exploration reveal themselves, worlds unfold around me, only to be forgotten by tomorrow’s lunch. Luckily, I’m working on an organization solution: software that can ingest all the little breadcrumbs I leave behind during the course of a productive day and try to make sense of them. I’ve already started sprinkling around these tokens of my progress, but the problem is that I often never pick them up again. What I’ve learned is that unless something is staring me in the face in the morning when I wake up, its at risk of disappearing into the void. Even then it’s a toss up.
So, what do these breadcrumbs look like?
They come in many different shapes and sizes: TODO lists written on sticky notes, other lists that don’t quite fit into the category of TODO, pictures I take of books and paintings for further exploration at some later date, voice memos, and sketches. Probably lots of other little bits that I’m forgetting too. The point is, whatever system I make has to be flexible enough that it can consume and piece together whatever I throw at it. I’ve tried adapting myself to the machine, using rigid planning systems where everything has a clearly labeled place to go. Inevitably, they never have the same tactile satisfaction or immediacy of a trail of ephemeral, physical notes.
My (scattered) motivations
My hope is that a system like this would help me see a bird’s eye view of the landscape of my thought. There are evidently many benefits of this. For one, context switching would be much easier. Normally, when I start off in a new direction the current project quickly overwhelms my other ideas. This isn’t a bad thing, as it lets me focus deeply on the task at hand. However, with the help of such a system I would be better equipped to recover the other, neglected branches after I reach a good stopping point on a given project. I’m also hoping that this level of organization would provide me a better sense of overall continuity in that it would allow me to see the patterns and trends in my progress towards various goals. Ideally, it would even find connections between my interests that I hadn’t noticed before. There’s a second motivation behind this as well: I want the system to be inspiring. I plan to design everything following a “mnemonic” approach in the sense that it should jog my memory in a way that recalls the excitement that spurred me to take the note in the first place. This is an effect I’ve often observed in physical artifacts, but rarely in digital ones. Going back over scribbled diagrams and the hurried writing of brainstorming sessions is much more evocative than a Word document could ever be.
I believe this a combination of both the inherent allure of physical artifacts and all the extra meta-information that gets filtered out when things pass from the “imperfect” physical world into the digital. This can mean things along the lines of the aesthetic quality of the writing, the paper it’s written on, and signs of aging. Using all these subtle physical markers, our minds are able to extract a dizzying wealth of information about even the simplest artifact. All of this information (which could be regarded as extraneous from a certain perspective) leads to new connections, which result in stronger resonances with memory. After I’ve finished a book, a similar effect allows me to remember not just that I’ve read something in it, but also whereabouts in the physical arrangement of pages. A rich contextual cloud of entwined observations (drawn from all these little sensory stimuli) followed me through the text as I was reading it, and help me pick up the thread.
A first prototype
As you might be thinking, this plan is a bit of a tall order. However, the latest developments in AI tools have made it a good bit easier. I’ve decided to start small by exploring what this software would look like if it just handled one type of information, namely, books. Many of the same ideas this generates will be applicable to the other forms of breadcrumbs as well. I also think that books are an interesting case, again from this perspective of how richly evocative they are as an object. This could be my book-lover’s bias speaking, but its impressive how much information can be drawn from the cover of a book, even information of a more “fuzzy” kind. If we put aside the advice not to judge a book by its cover, it’s possible to deduce many other features besides the natural ones like “title” and “author”. For instance, you can usually tell things like genre or seriousness with a reasonable level of accuracy, the age, and maybe even the publisher. This makes the cover of a book a highly information rich artifact, but also a very interpretable one. I find that when I glance around the room at my stacks of books, my perception seems to parse them the way you would read a sentence. Just like you don’t read the individual letters of a given word as you scan through a sentence, I see each book as a fuzzy collection of properties that form a heuristic allowing me to identify them almost instantly. My most loved books are intelligible to me not as a pairing of title and author, but rather as a certain combination of color, shape, and texture. This richness of will prove to be powerful when it comes time for making visualizations.
Semantic clouds
The first visualization I’ve decided to try is a map of the semantic similarity between a collection of books. Ideally, books with similar content and genres should appear closer together on the map, and form little islands. This should make it immediately clear what the different thematic focuses of the collection are at various levels of specificity.
Just a few years ago, this would have been a rather challenging task, but nowadays it’s pretty straightforward, and the results are nonetheless impressive. This comes down to a very useful technology called “embeddings”.
What’s in an embedding?
The term has been thrown around a lot in the last few years as a result of their foundational importance to LLMs. The idea is a simple but powerful one. A text embedding is just a big list of numbers that encodes the meaning of a piece of text. Each number in the list is a decimal and the list may be over a thousand numbers long, so you can well imagine that embeddings are capable of representing very subtle shades of meaning. You can think any number at a given position in the embedding as encoding a particular property of the text the embedding model was fed. For example, the 116th number in the list might represent the seriousness/lightheartedness of a passage, or how technical/abstract it is, and so on. In reality, the meaning of each individual number is something that an embedding model learns on its own (so kind of a black box), and is probably much less clearly defined than that. However, when you put all of those numbers together, you get a useful encoding of the semantic content of a piece of text.
What’s the big deal about numbers?
A big list of numbers is a lot more useful to a computer than a piece of text in natural language because it’s a lot easier for it to understand, and because can do math with numbers. For example, we can treat each number in the embedding as a coordinate in some n-dimensional space (where n is the length of the embedding). Then, embeddings that are physically “closer” to each other are more similar. That means that if I encode the word “dog” and the word “cat” they’ll be pretty close, but not as close as “cat” and “kitty”. You can also subtract one embedding vector from another to do fun things. The canonical demonstration of this goes along the lines of: king - man + woman = queen. There are obviously lots of cool applications of this, but what we’re focusing on today calculating the similarity of two embeddings by finding their distance.
What to embed?
So, we have a bunch of books and we want to compare them. Let’s say we have a few pieces of information about each, like title, author, and description. If we had the text content of each book, we could try to convert that into an embedding. That would definitely be the most accurate, because what is a book if not its contents. Unfortunately, you would quickly find that current embedding models are just not capable of processing that much text. Instead, we need something smaller, so we’ll turn to the description. In the best case, where we get lucky with a good blurb writer, the description will provide a faithful and concise summary of the book’s contents. This won’t actually happen too often, but as it turns out, it’s still good enough.
Visualizing the output
After we take the description of each book and run it through the embedding model, what do we do with them all? If we have some code that can compare two embeddings, we could compare each book to every other and find out what books are most similar to any given book that way. That’s useful on its own, but what we really want is a way to see every book in relation to every other. I wasn’t lying when I called it a map. The problem is that, as discussed, embeddings are really long. Even though we can easily treat them as coordinates in the mathematical sense, trying to imagine what a thousand-dimensional space looks like isn’t going to work out too well. What we need is a way to compress these big, rich semantic representations down into something workable (read 2 or 3 dimensions) without losing too much information.
Compression magic
Luckily, many intelligent math people have been working on this problem for a long time, and there are various techniques that can be used. The key is to look at the given dataset (in this case the embeddings from our collection of books) and decide which terms of the embedding vector are the most important to keep. The terms that are most important, for our purposes, are those that change the most between the items in our dataset. This is because they are most likely to help us find meaningful correlations and differences between our books. Given that we are only feeding book descriptions into the embedding model, there are probably tens or maybe even a hundred shared terms between the embeddings (terms very close in value) that simply encode the fact that the text looks like a book description in terms of style and content. If we kept these dimensions instead of being more selective, we would be wasting a lot of information due to redundancy. We already know we’re dealing with books, so we’d like to isolate those terms that relate to things like subject matter, or genre.
The simplest method for extracting these important terms is the aptly-named Principal Component Analysis (PCA). This method does what we just described: it extracts the terms with the greatest variance between the embeddings we give it. However, we can do better than that with another, more advanced technique called Uniform Manifold Approximation and Projection (UMAP). What makes it better you ask? I really couldn’t tell ‘ya, there my math knowledge ends. Something about more accurate preservation of the global structure of the data, which sure sounds good. Anyways, empirically speaking, it does actually seem to work better. Using UMAP, we can now take our collection of book embeddings and convert them into a set of points in either 2 or 3-dimensional space. From there, it becomes a simple job to graph them in a form easily interpretable by human eyes.
The grand reveal
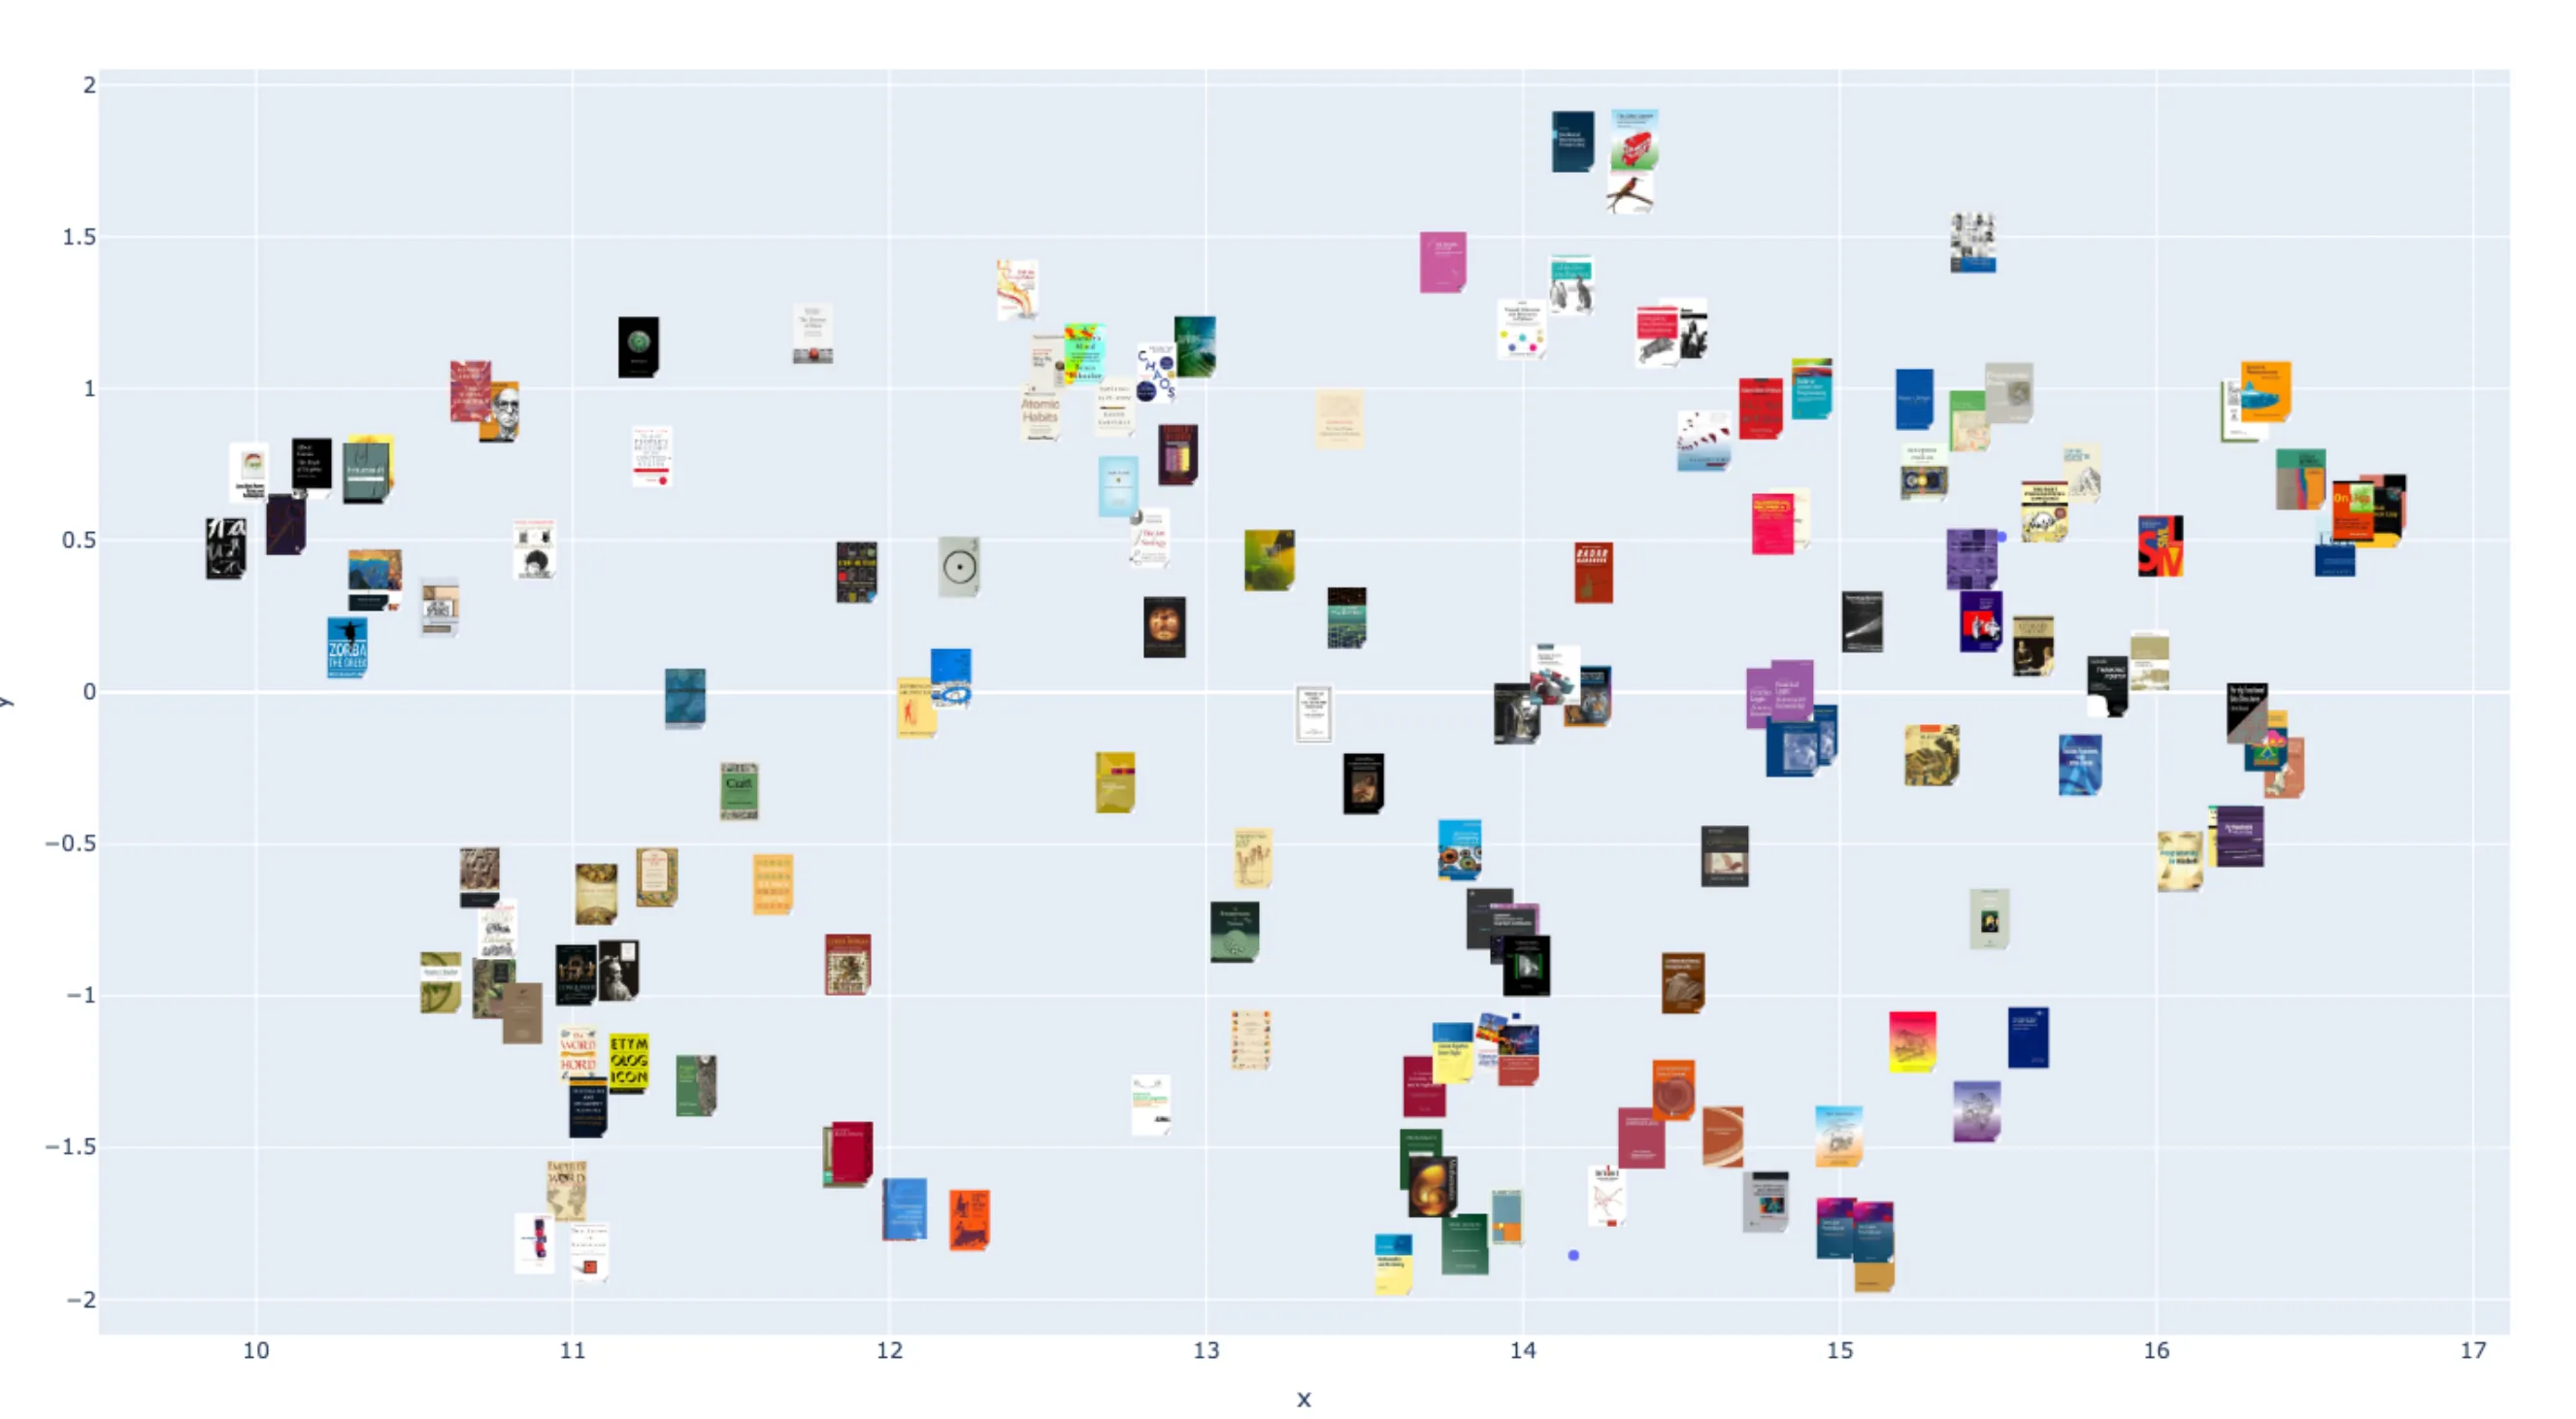
As you can see, this is (a portion of) my reading list, successfully plotted in 2d semantic space! Most of these are technical, non-fiction books, so it appears they’ve been loosely grouped by subject matter. If you zoom in further, you can see that the groupings are pretty successful for a first test, even though we went from over a thousand dimensions down to just two.
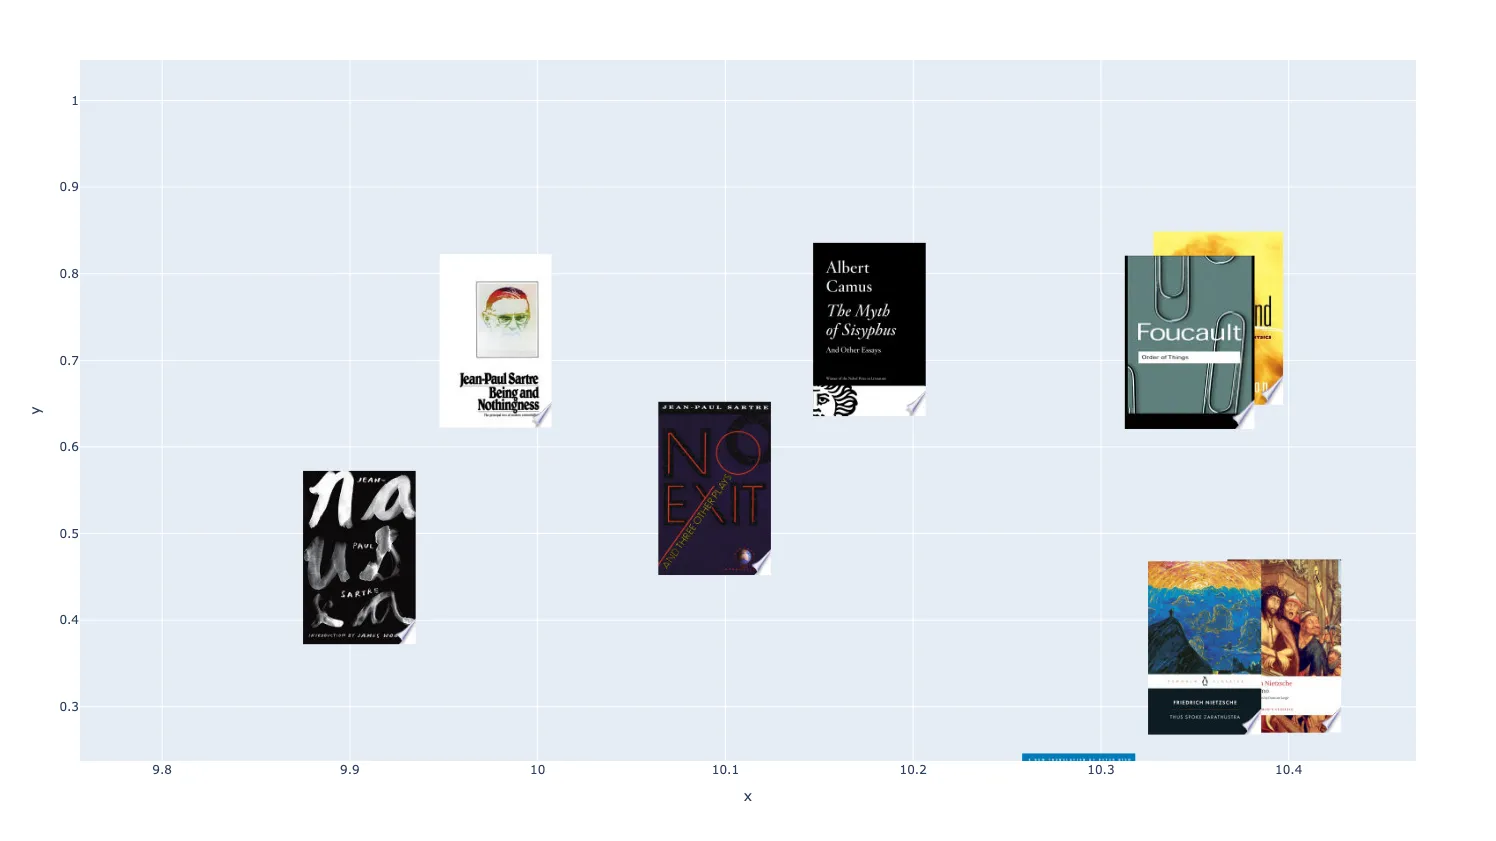
Here we’ve got Sartre, Camus, Foucault, and Nietzsche all in their own little corner. The system automatically sniffed out all the philosophy books and stuck them together. Many more examples abound, showing that even such a week indicator as the description of a book is enough to pretty accurately place it. But, what might happen if we were to stretch things out to 3 dimensions?
That also works! And quite a bit better too because you’re keeping a whole extra dimension’s worth of information. I think this is my favorite way to visualize the information because it just looks really cool. While the 3D plot is shown as a video here, it’s actually just a screen recording of an interactive program I made that allows you to zoom and orbit around the semantic cloud at will (which you can play around with here). This is a very successful proof-of-concept since the graph is as easily interpretable as I had hoped it would be. Because of how evocative the book covers are, I’m able to discern at a glance what each of the clusters is supposed to represent. This probably isn’t the case for you, unless we have eerily overlapping interests, but imagine it with your own bookshelf! Pretty cool, huh? Seeing them pictured here also acts as a strong reminder of the experience of browsing around to find them in the first place, and what motivations were rattling around inside my head back then.
Next steps
One feature I believe could be made even more powerful is zooming in on a section of the graph. The visualization works pretty well for this size collection of books (around 100), but things will become more challenging to manage as the dataset grows larger. Also, the dimensions of the graph will necessarily become less meaningful as more books are added, especially if those books are from disparate domains. Imagine, for example, if I were to create a collection that was half fiction, half non-fiction books. This would likely waste a lot of visual information (an entire axis) on a simple fact that could be easily determined through traditional methods, without ever touching embeddings (most sources of book information include tags for properties like genre). It would instead be possible to make it so that when you zoom in on a particular region the dataset is reduced to just the books contained within that space. Then, if the user were to zoom in on the fiction books, in this example, that section of the embedding similarity graph would be recomputed. Crucially, the dimensionality reduction would be performed in relation to this reduced subset of the collection, and therefore the graph could tease out new relationships. The zoom operation would cut out all the non-fiction books, leaving the graph free to represent some other useful metric, like “seriousness” or “romance”.
The main next step is to build out the other parts of the software that allow for managing collections, inspecting individual books, and performing other analyses. I would like this fuzzy, semantic classification to work in tandem with more traditional methods like tagging (though those tags might themselves be AI generated). Anyways, hopefully I make progress on this and it becomes something anybody can do with their books! More updates soon.
Technical notes
I wanted to keep this post approachable, but I thought I would leave a bit of information here about the technical aspects of how all this was implemented for anyone following along at home. If I ever get around to putting the code up somewhere, that’ll be linked here too.
I used python for the bulk of these experiments. The description embeddings were generated using OpenAI’s text-embedding-3-small, and the dimensionality reduction was performed using umap-learn. The 2D plot was created using the plotly library. The 3D visualization was a bit different. The point cloud data was exported from the python script, and then loaded into a program created using the Godot game engine. This made it really simple to create a satisfying, interactive demo, and I would highly recommend it.