Ripple Drum
The basic idea for this one was to make some kind of setup to measure the position of hits to the surface of a drum, and then visualize that data somehow. As I was brainstorming about the visual element I started to think about waves, in the sense of the sound waves a drum produces when it’s hit. While I have no understanding of how it plays out with physics in the real world, I imagined the waves propagating outward from the point of impact, spreading and interfering like the ripples in a pond when you skip a rock. That brings us to the final product, an electronic drum with a connected web visualization, which produces ripples in a simulated pond whenever the drum is hit.
The Visualization
I’ll start here, because it’s pretty fun to look at. In terms of the technologies involved, it’s not very complicated. The ESP32 creates a WiFi hotspot, and serves the visualization webpage. The cool part about this setup is that the visualization acts as a captive portal, so as soon as you connect to the ESP it just pops up, like login pages often do (a little note, unfortunately the performance of the JS canvas seems appreciably worse in the captive popup). The sensor data is transferred to the webpage using a websocket server, where it’s visualized. The pond simulation is written in pure JS, and uses the HTML5 canvas.
The Simulation
When I initially had this idea I was worried about how feasible it was, because simulating water seemed like it could be a complex problem. Luckily, though, I was able to find a description of a really simple (and fast) algorithm from a webpage (an archive) that looks an awful lot like it came out of the 90s.
The algorithm it describes bares a lot of resemblance to common cellular automata, like Conway’s game of life. It operates over two 2D grids of pixels that are meant to represent the water. The way that a given pixel propagates through the grid is determined by a simple calculation that involves summing up its neighboring values. A few easy rules come together to produce compelling simulated water, with waves that spread out and interact with each other.
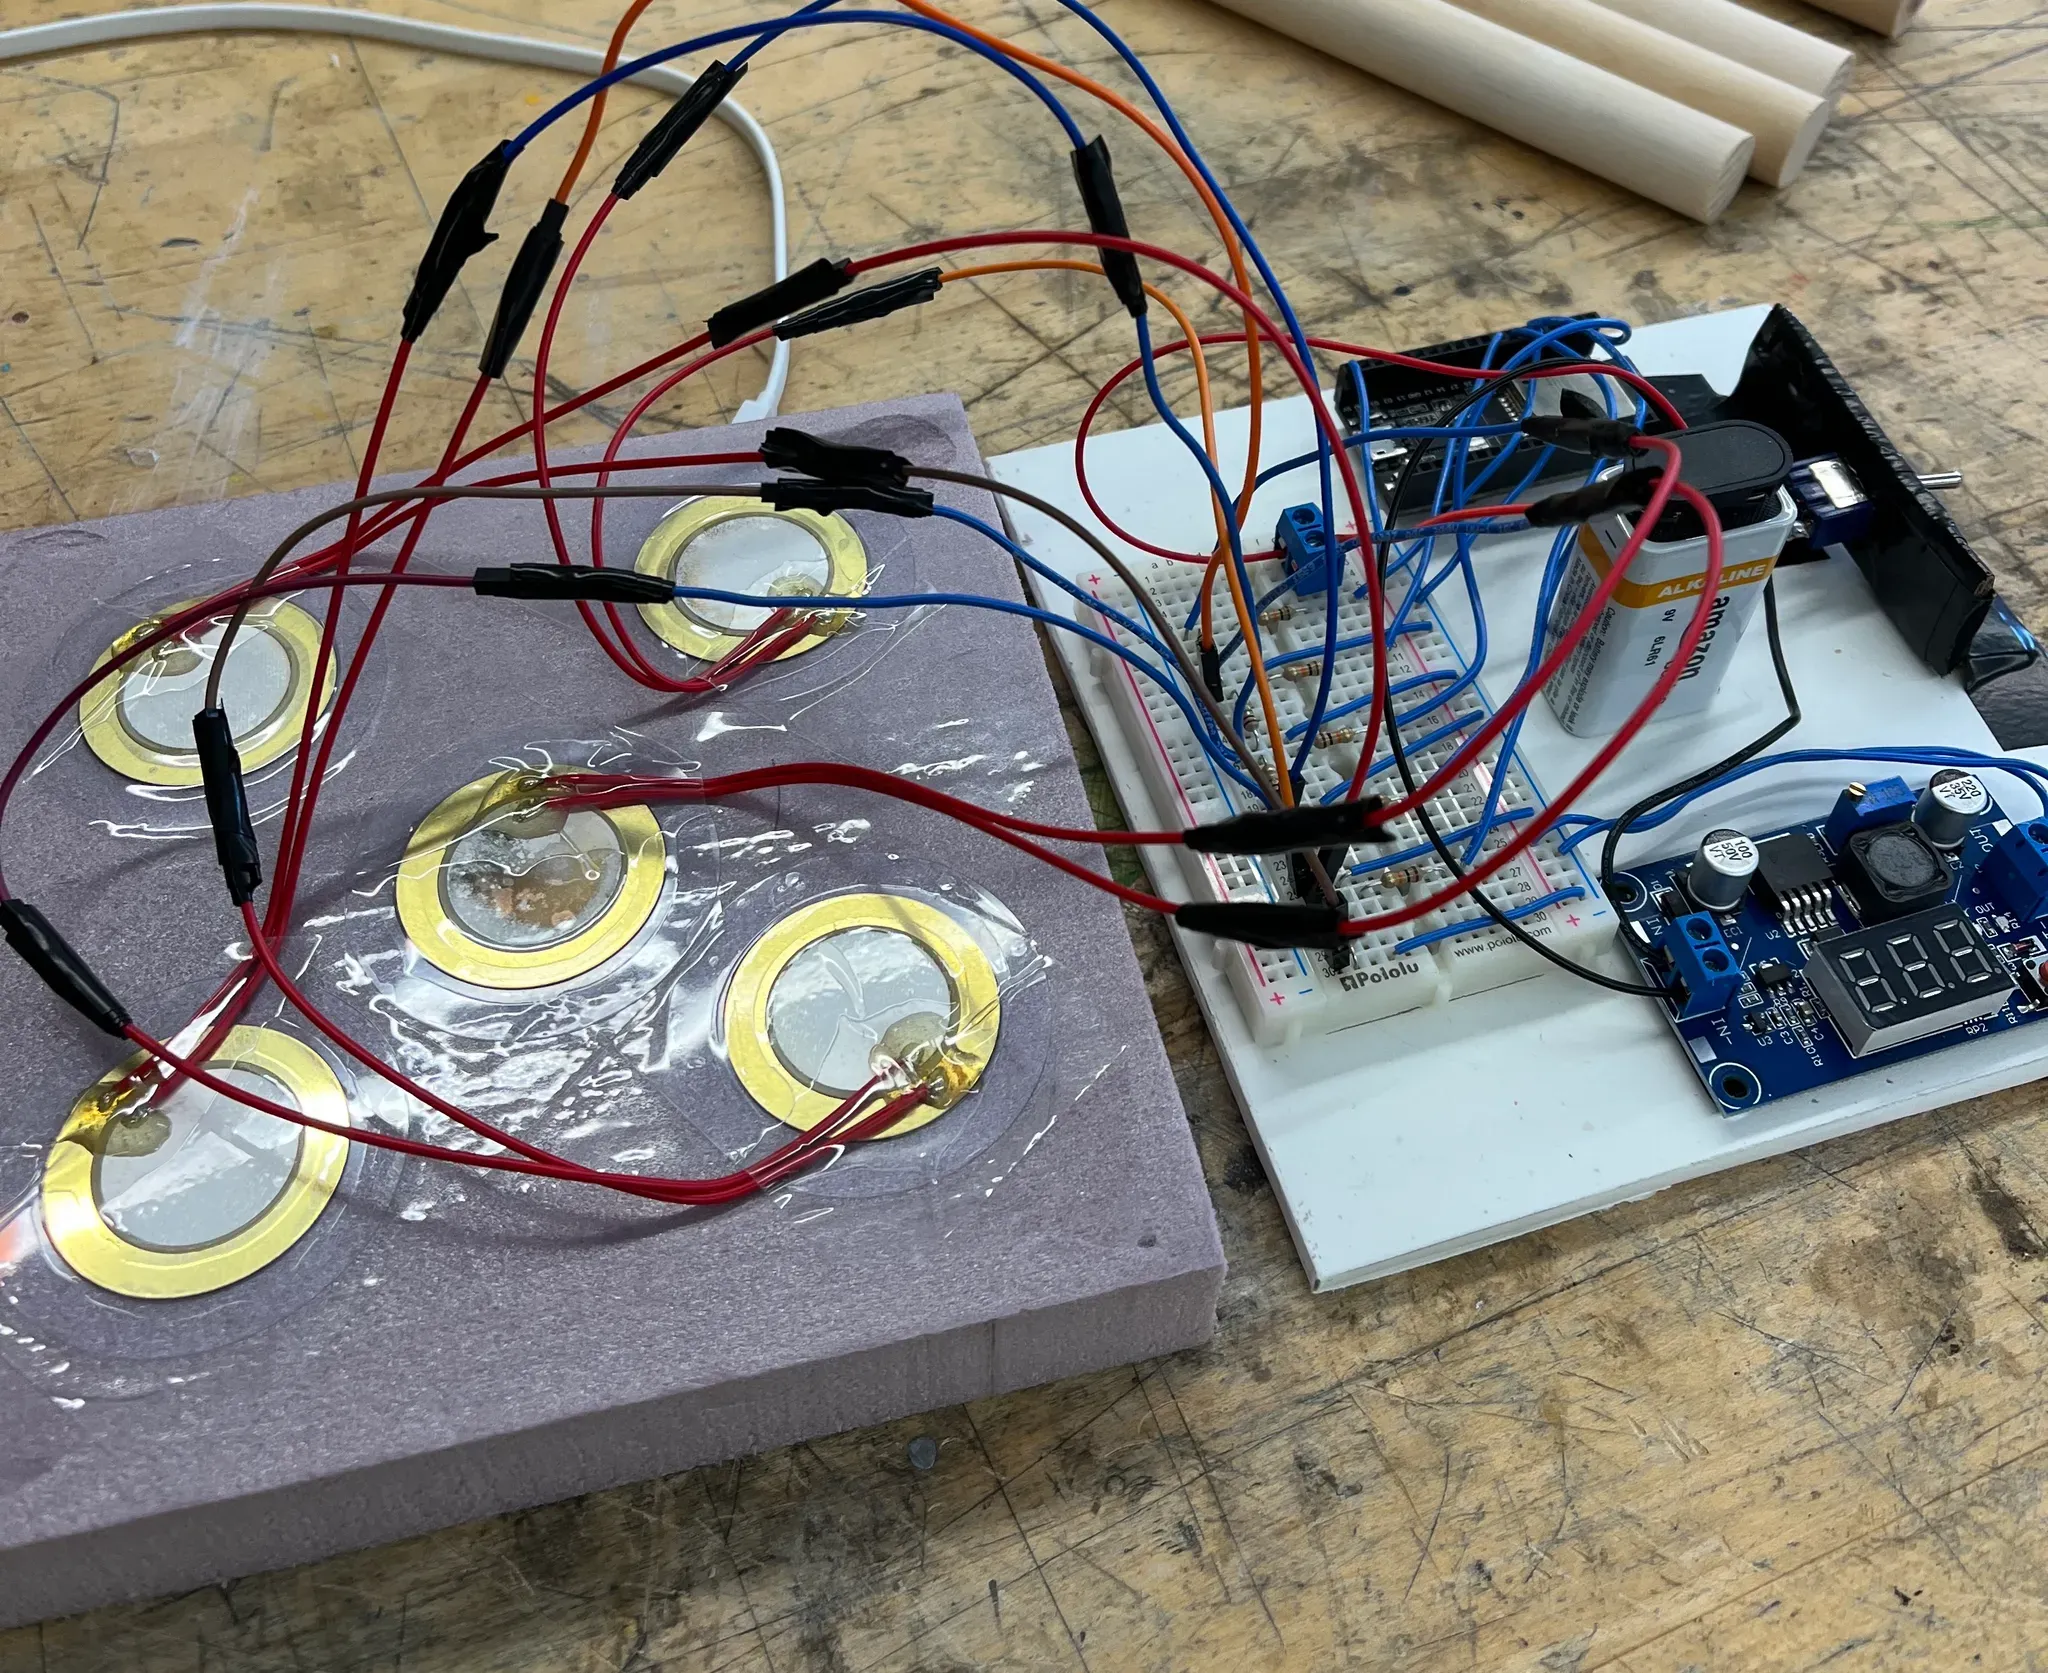
The electronics
I quickly realized I would need multiple sensors in order to determine the position of the impact. Capacitive sensors weren’t a great fit because they only work with certain objects, mostly organic, and I wanted to be able to hit the drum with anything and have it work in a very intuitive way. This meant I ended up using piezo sensors, which seemed a natural fit since I was trying to detect vibrations. They aren’t quite as precise as another kind of sensor might be, but this adds an interesting element of randomness. The drum uses five of them, arranged in a star pattern. Based on the different intensities it detects, and a knowledge of where the sensors are placed, it’s able to roughly triangulate the position of a hit. However, the triangulation calculation actually happens on the webpage. All that’s done on the ESP is serving the page, and sending over the data.
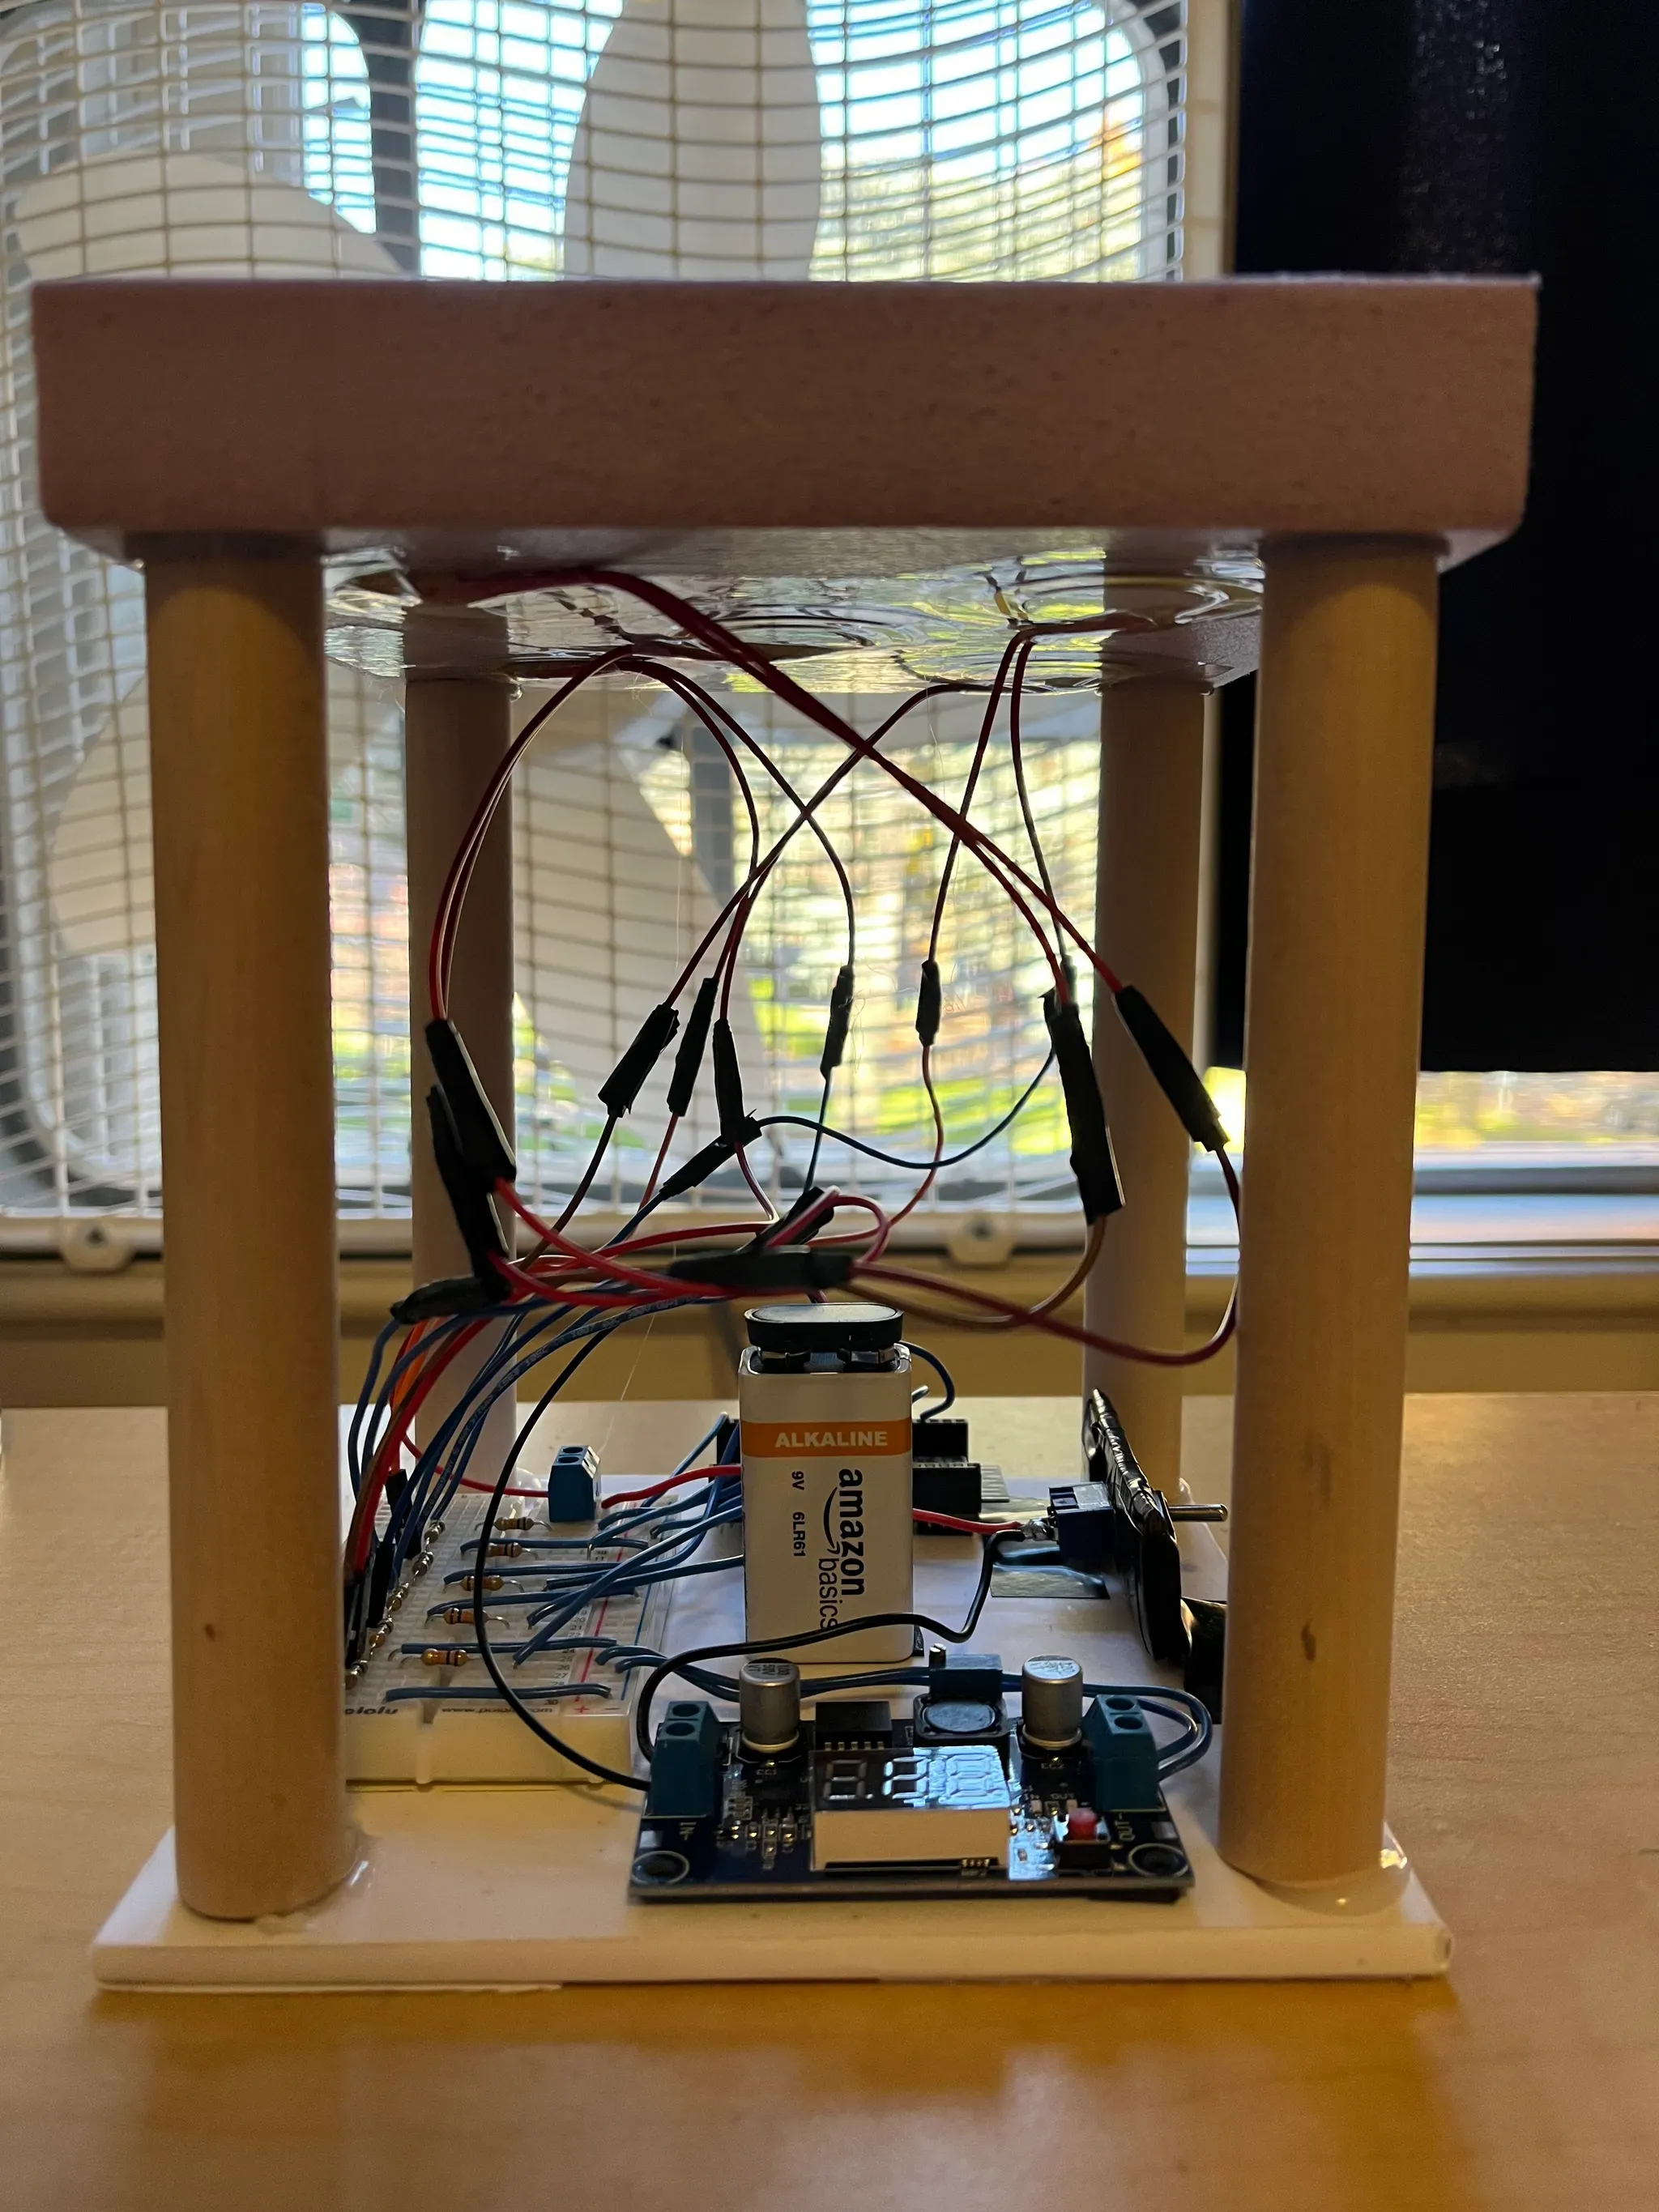
Features
For my battery power solution, I decided to use a single 9 volt disposable battery, connected to a buck converter to step the power down to 5 volts. This turned out to be a relatively painless way to power everything. The device can be turned on and off using a switch wired in series, so that it doesn’t drain the battery when it’s not being used. The drum also comes with an included mallet (wooden dowel), which is surprisingly effective at increasing the intensity of the impacts. The edge of the dowel is somewhat sharp, which has the interesting side-effect of leaving marks on the soft foam surface of the drum. In this way, as the drum is used it gradually takes on evidence of its age, expanding this piece of art into the temporal dimension!
Repurposing
This project shares a direct lineage with my previous projects in that many of the same electronic components and software technologies are used. The general premise of the program is the same as for the TunePlayer project, since the box/drum itself is just generating data, which is then sent over to a computer for a rich, computationally intensive visualization. While there is very little in terms of reused algorithms, except for some simple helper functions, the visualization took the form of an HTML5 canvas website, much like in the first project. This time, though, instead of using the web version of processing, I used the plain canvas since it seemed more performant, and I didn’t need many of P5’s features. Many of the breadboard management techniques I learned for my last wiring-heavy project also proved invaluable.
Imagery